
My Log Source-Agnostic Methodology to Understanding Big Data
Cybersec Café #68 - 05/20/25

After writing about my SIEM-Agnostic Approach to Detection Engineering, I realized I had to skip over a critical piece to stay on topic.
That missing piece? Phase III: Diving into the Logs.
If you’ve been in the field for some time, it can sometimes feel like parsing and understanding logs manually is seen as a “second-nature” skillset. But I can still remember when it wasn’t for me. Early in my career, log analysis felt overwhelming, and honestly, it still can be if you don’t have a mental framework to guide you.
But being the analytical thinker I am, I like having a methodology I can fall back on - especially for something as foundational as understanding logs.
Why does this matter? Because as a blue teamer, both threat hunting and detection engineering sit squarely in my wheelhouse. And the one thing they both rely on?
Understanding the data.
You can’t write solid detections if you don’t know what to look for. And you can’t hunt a threat if you don’t know what a threat even looks like.
That’s where my Log Source-Agnostic Methodology comes in. We need to know how to break down big data into something actionable, no matter where it comes from.
To walk through it, let’s use a common log source in the corporate world: Okta.
Here’s a sample log:
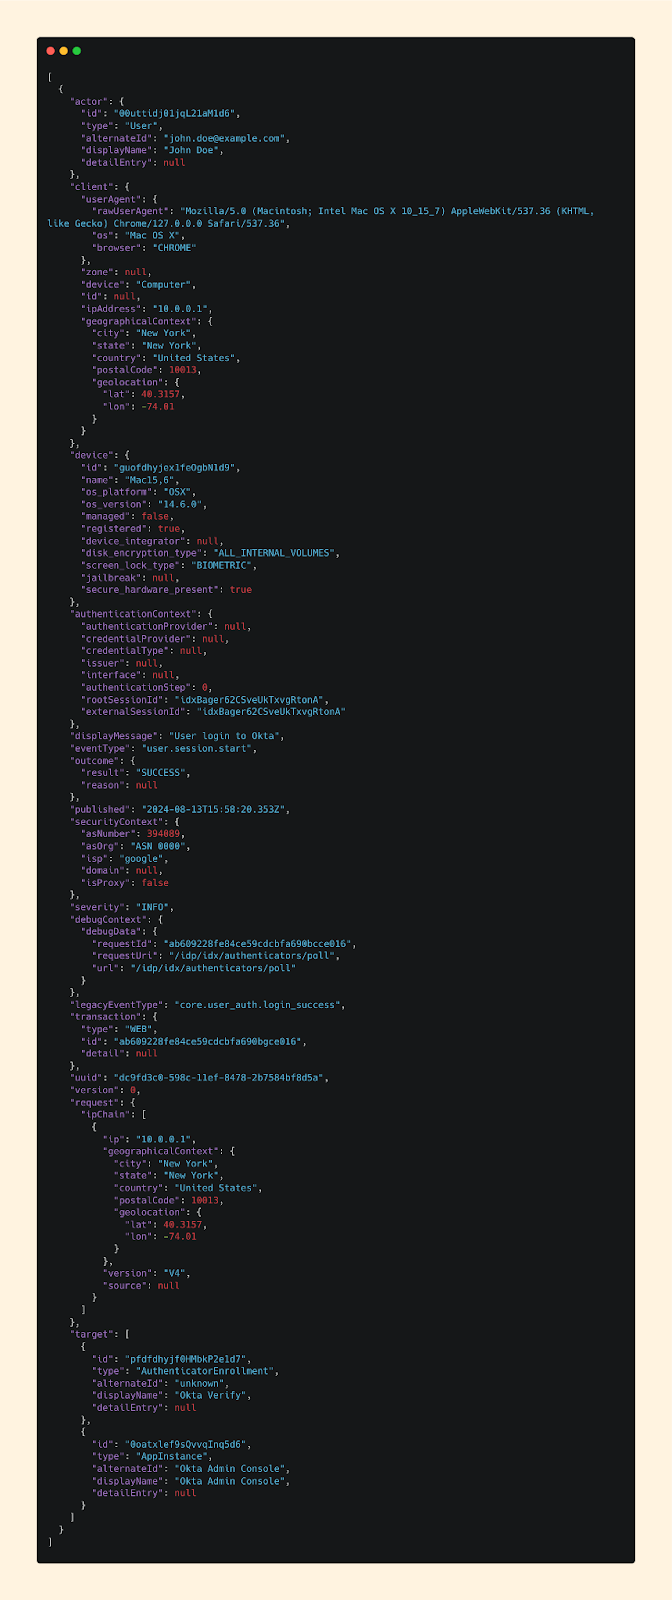
If this is your first time looking at an audit log like this, I can totally empathize that it can be intimidating.
What you’re seeing here is called JSON, or JavaScript Object Notation. It's a standardized format used across applications for representing and exchanging data, and is commonly used across applications to structure data in a way that’s both machine-parsable and human-readable. Everything you see here is a simple key:value pair.
And if you’re unfamiliar with Okta, it's an Identity and Access Management (IAM) platform that organizations use to manage user access to applications and resources. It offers security features like Single Sign-On (SSO) and Multi-Factor Authentication (MFA) to help secure user identities.
In short - what you’re seeing here is an authentication log. Simple.

Methodology
Step 1: Where to Start
While everyone may have their own process for digging into and understanding log source - I’d be willing to bet most of us start in the same place:
Event Type & Event Name
Event Type is a general category or classification that groups together events based on their purpose.
Event Name is a more specific identifier to uniquely distinguish each event.
In many log sources, you’ll find both fields. But Okta’s logs are a great example of how formats can vary, as Okta only provides an eventType:
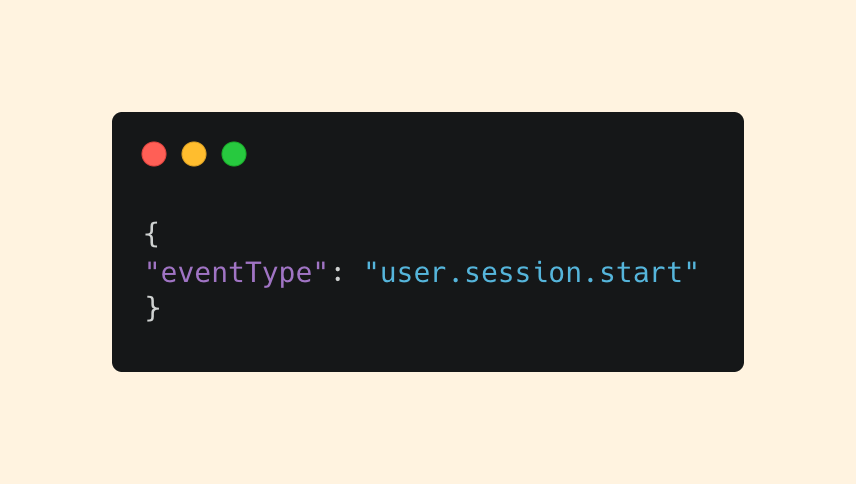
That’s where a little deductive reasoning and good, old-fashioned documentation review come in handy.
While Okta doesn’t explicitly document a break down of the format, we can see that they use a period delimiter to section each value into 3 different parts:
`category.eventType.eventName`
In our example, we can see that a user has started a session from user.session.start.
To further confirm, we can look at additional fields like displayMessage and outcome:
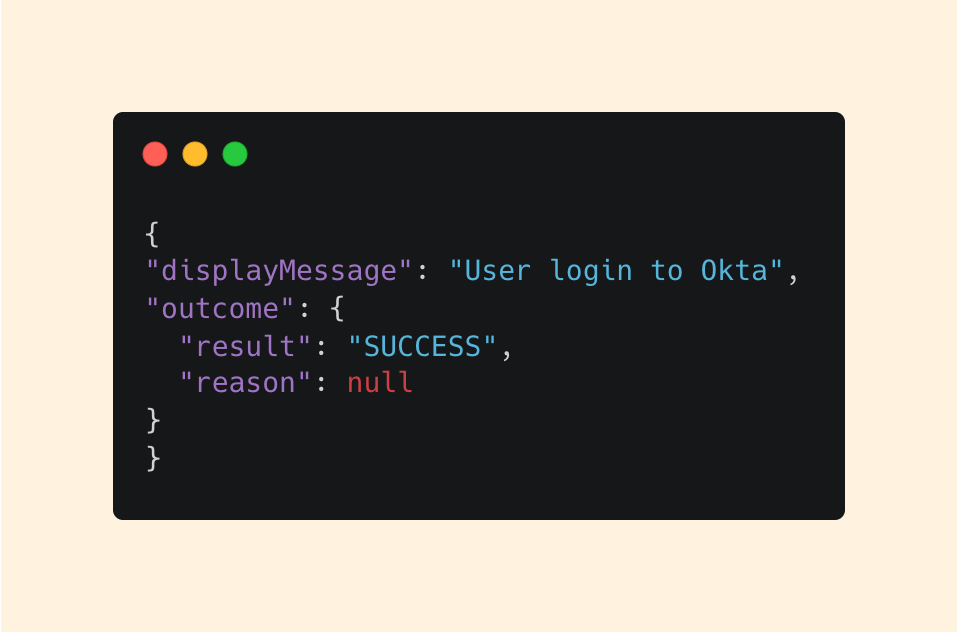
The displayMessage reinforces our assumption, and we can see from the outcome that the user was successful in their attempt.
I think it’s also important to call out a key value pair you may have noticed in the raw log: legacyEventType.
This is a deprecated classification included for backward compatibility. While it can be used, it’s better we focus on the currently supported eventType field.
Step 2: Who?
Once we understand what happened, the next step is figuring out who the log is about.
This definition of “Who” can vary based on the log source and use case, but generally, we are trying to identify the user or account tied to the event
In Okta logs, we start here with the actor key:
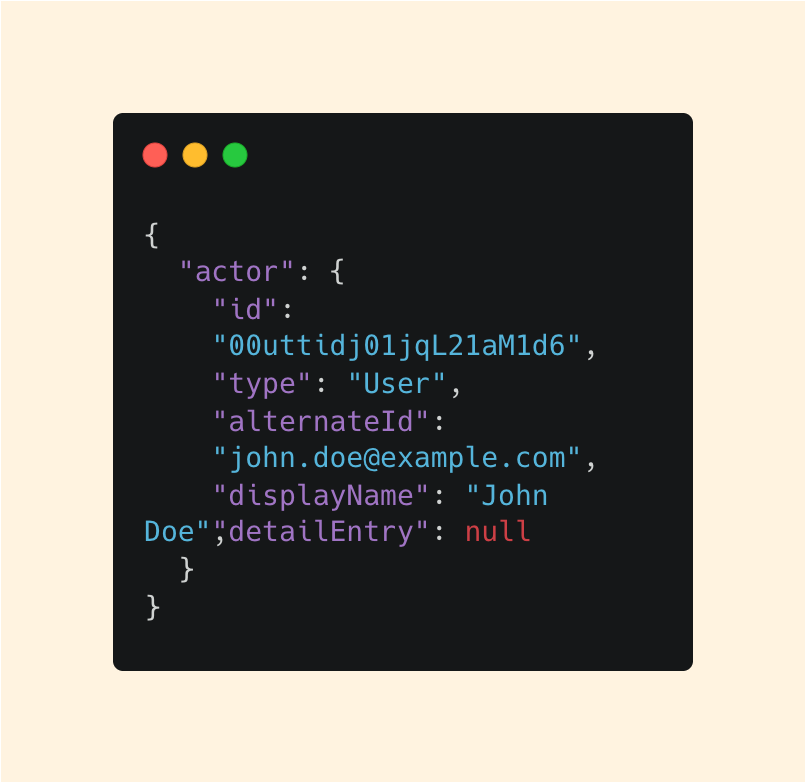
Even though actor includes multiple fields, we don’t need to dwell on every detail. Our goal is clarity.
The alternateId, which looks like an email, and the type, which tells us it’s a user, look to be the most useful to us.
Next, let’s move to the client. Specifically, the rawUserAgent:
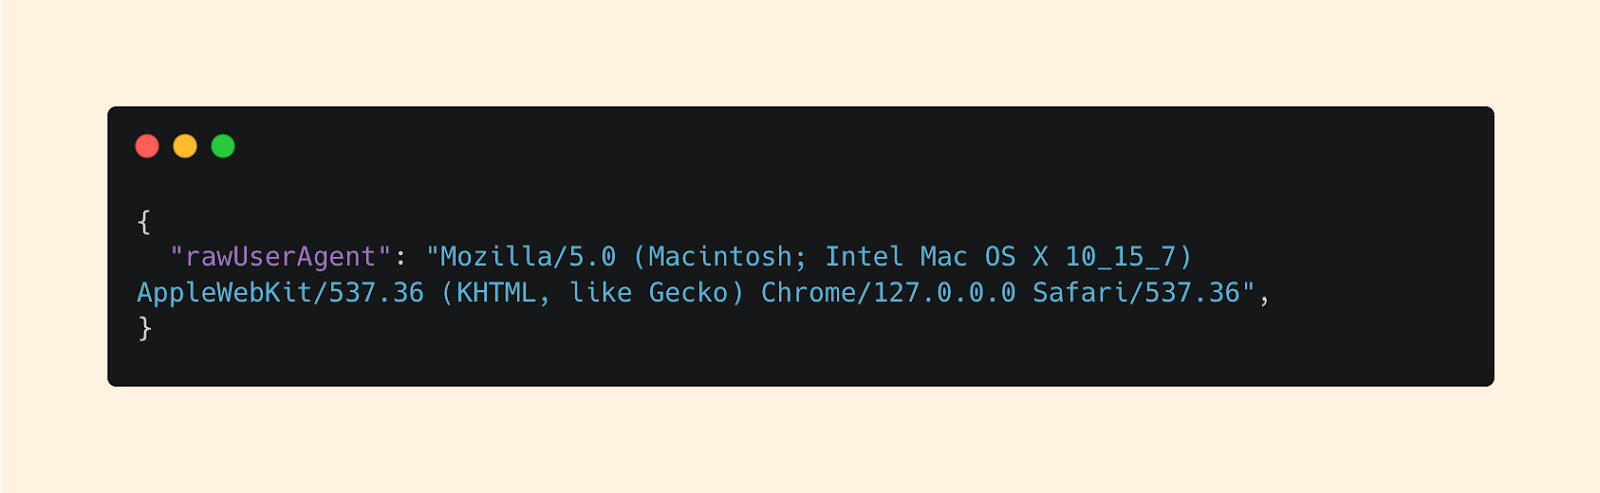
While some of this info is further parsed for us, the rawUserAgent gives the full fingerprint of the device. This can be incredibly useful especially if you have an inventory of the expected devices that users have.
Device: Mac
OS Version: OS X 10.15.7
Browser: Chrome v 127.0.0.0
Lastly, let’s move on to target:
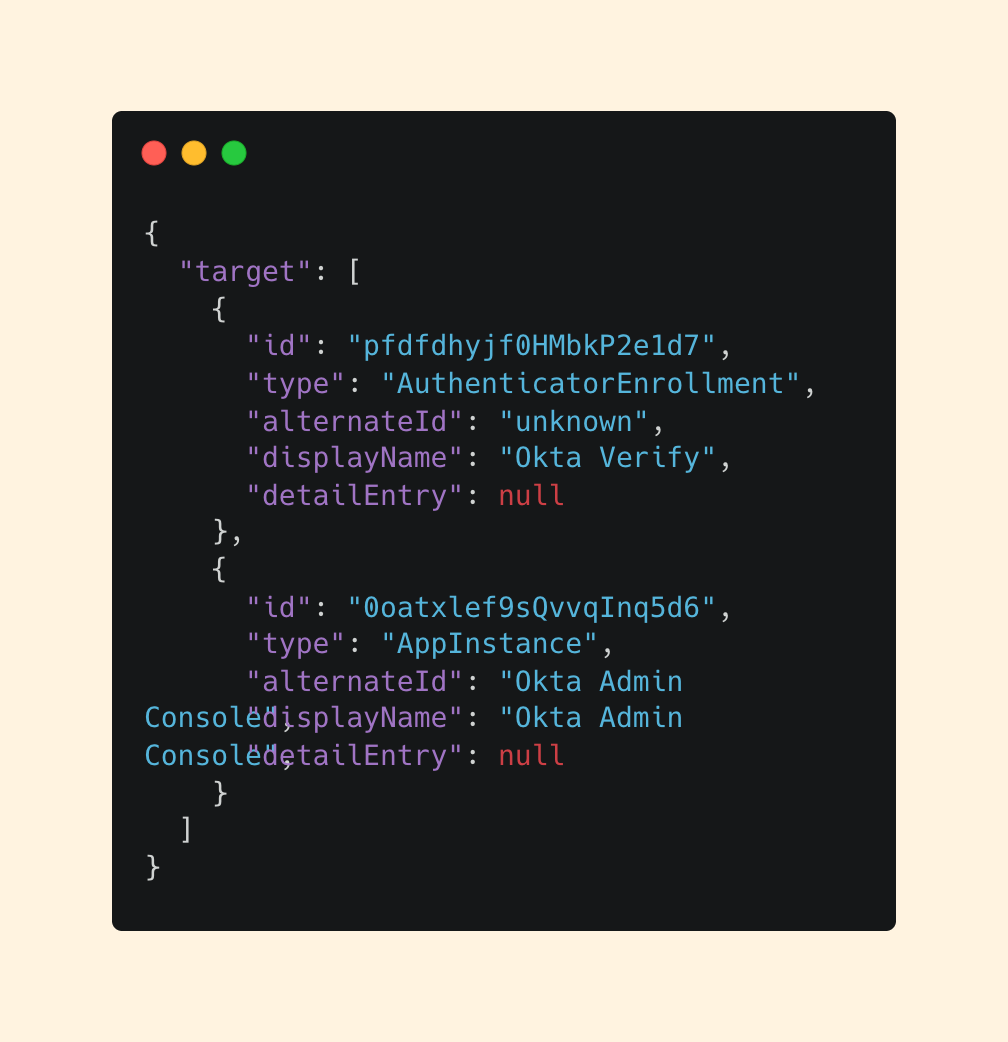
In Okta logs, the target represents the object or entity the action is being performed on. This varies based on the eventType, but in this case, we can see the action involved Okta verify in the Okta Admin Console.
Step 3: Network Information
Now that we know what happened and who did it, let’s figure out where it came from.
Network data is a goldmine for triage and investigations. With the right queries and a bit of context, you can quickly determine whether a request is expected or suspicious based on historical patterns.
There are a few key:value pairs in particular that I’m interested in:
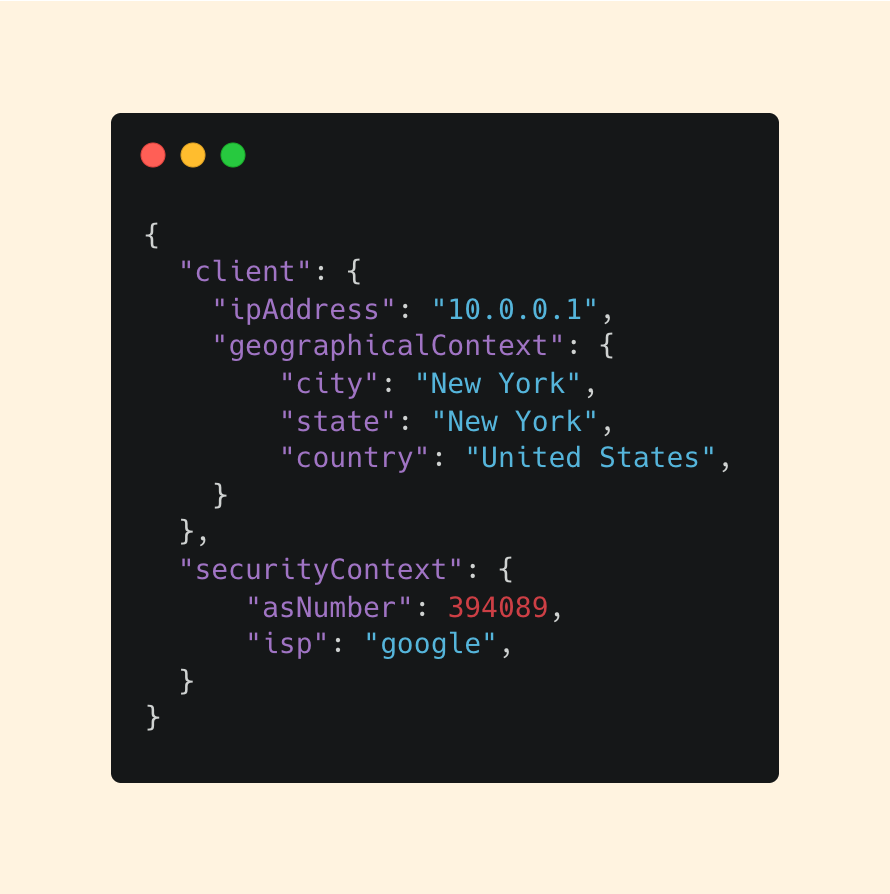
Let’s break it down.
Our IP Address in this example is a local IP, however for the sake of this example, we can see that this IP address is a Google IP originating from New York City.
This should immediately make us curious of:
Is this a common IP this user uses?
Does this user live in New York?
Is this IP consistent with past behavior?
This is where saved queries can come in handy. If we take our alternateId from earlier, we could plug these directly into a saved query and quickly determine the user’s normal behavior patterns.
For now, we can continue under the assumption we don’t see any red flags. But this step is key. Don’t underestimate how much insight a single IP address can provide.
Step 4: Additional Context
Once you’ve answered the what, who, and where, it’s time to dig a little deeper.
This step is all about uncovering any additional context that might enrich your understanding of the log.
Depending on the log source, and sometimes even the specific event type, this context can vary.
Okta is a perfect example: some events include fields like debugContext, while others don't:
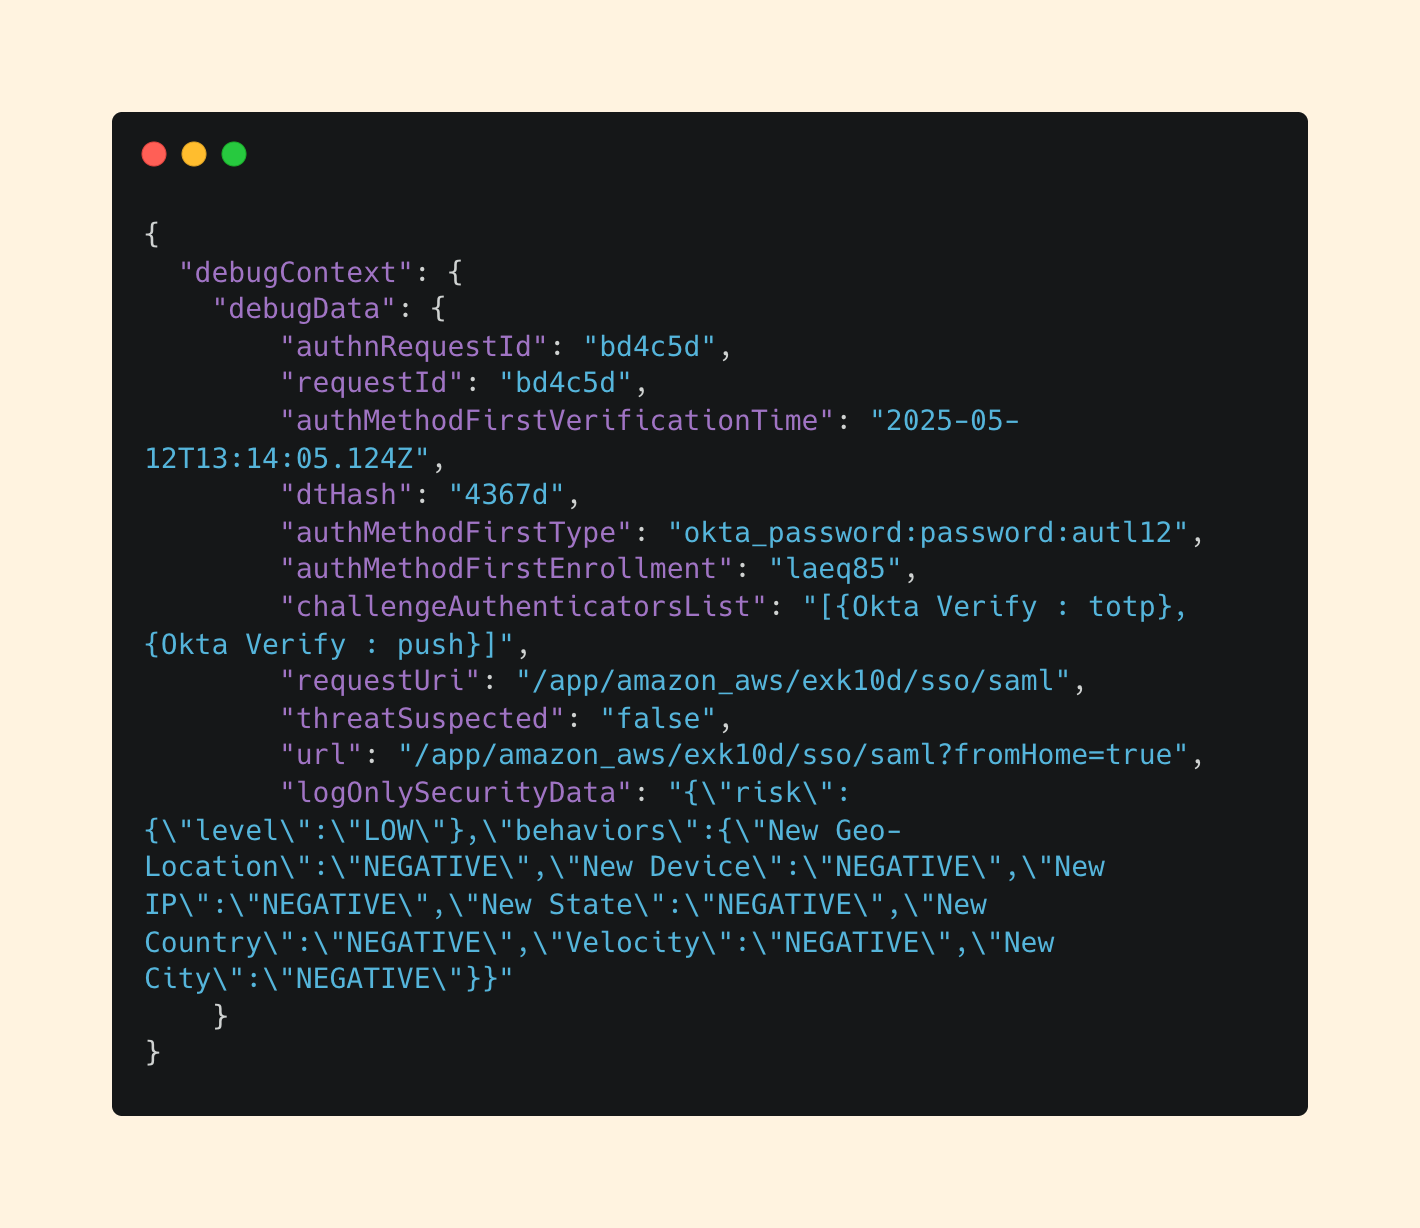
While this may seem like a lot, it’s important to focus on what’s actionable here from a human readable standpoint.
If your eyes gravitated to logOnlySecurityData, then we’re on the same page. This field contains results from a behavioral analysis using Okta’s Threat Detection engine.
We can see here that the risk level is Low based on a set of 7 behaviors it weights to calculate a threat. The more POSITIVE signals, the higher perceived risk.
While not every event will include this kind of data, when it’s there, it can offer valuable insight into the Why behind an alert.
Step 5: Put it Together
Now that we’ve take the time to understand this log piece by piece, let’s synthesize everything with a clear statement:
“John Doe successfully authenticated to the Okta Admin Console from an IP located in New York.”
Summarizing log data into human-readable statements like this is powerful. It transforms machine-parsable data into something understandable and actionable for humans.
And with that, you’ve successfully reasoned your way through understanding an Okta log! But still, you might be wondering…
- Today’s Sponsor -
Prepare for a career in Cybersecurity, one sip at a time with The Security Sip. With rapidly evolving threats and technologies, many struggle to gain the right skills and experience to break into the cybersecurity industry. This course is designed to transform beginners into industry-ready professionals over 12 sections, 85 modules, and 155 exercises. Check it out!
How do I scale this process?
If you’re thinking: “There’s no way I can break down every single log like this” - you’re absolutely right.
The process we just went through works for understanding an individual log - but it doesn’t scale to the volume we’re up against. We’re talking hundreds or thousands of logs per minute - millions per day in most environments.
To move from understanding a single log to understanding the entire log source, you need strategies that scale. Here’s where to start.
Dig Through the Documentation
If you’re a long time reader of the newsletter, you’re probably tired of hearing it at this point, but I’ll say it again.
The documentation will tell you what you need to know.
Granted, not all docs are created equal, but if you’re working with an enterprise-grade app, the chances are the documentation will give you the key details.
Start by looking for event types that signal potential malicious activity, privileged actions, or rare/abnormal events in your environment.
Read through these with an attacker’s mindset. Even if the docs aren’t perfect, they’ll give you a solid foundation and a sense of what matters most in the log source.
Understand What’s Normal
Once you’ve got your bearings, the next step is to understand what normal looks like for your environment.
Your ability to do this depends on how long you’ve been ingesting the log source - the longer, the better. But if you have at least a month of data, that’s usually enough to start seeing some patterns.
Begin with event types. Focus as much on the frequent events as the infrequent. Sometimes the rare events are the most telling, but consistent noise can also reveal useful baselines. Flag anything that catches your eye or raises a question.
Then move on to users. Look for common user accounts, service accounts, and privileged users. Again, pay attention to users with high activity as well as those who barely show up. Cross-reference what you find with any internal documentation you have, especially for service accounts.
Next, inspect network information. Where are your users typically logging in from? Are there geographic patterns tied to your office locations or known remote teams?
Finally, focus on log source-specific fields. For example, in Okta, this might be the target key. The choice will differ between choices, but they often hold unique details that make a log source valuable.
See how this is all starting to fit together now?
Expand Your Scope
Now that you’ve identified key details and have identified specific event types, users, network patterns, and unique fields - it’s time to go deeper.
Log sources can be dynamic. As we saw with Okta’s debugData, certain key:value pairs may only appear in specific event types. That means you'll need to look at your logs holistically - not just at the surface level.
Comb through your data with curiosity. What fields change? What values seem significant? What’s worth digging into further?
This isn’t a one-and-done step, it’s an iterative process. The more you explore, the more you might uncover.
Why Does This Matter?
For Detection Engineering
The better you understand your logs, the better your detections will be. Familiarity with the schema helps you write higher-quality detections that are tailored to your specific environment.
For Threat Hunting
When you’re threat hunting, speed and precision matter. Knowing the structure of your logs means you can build and pivot fast, spot anomalies, and zero in on what matters without wasting time guessing field names or what data lives where.
For Incident Response
The middle of an incident is the worst time to learn a log source. Familiarity means faster triage, quicker containment, and a greater chance of reducing the blast radius.
TL;DR: End-to-End Methodology
Start with a single log.
Break it down - look at event types, users, network info, and log-specific fields.
Read the documentation - focus on events tied to risk or privileged actions.
Establish a baseline to learn what’s normal in your environment.
Expand your scope and explore different event types and patterns.
Identify key:value pairs that change across events or stand out.
Iterate - keep digging, refining, and building context over time.
Securely Yours,
Ryan G. Cox
Just a heads up, The Cybersec Cafe's got a pretty cool weekly cadence.
Every week, expect to dive into the hacker’s mindset in our Methodology Walkthroughs or explore Deep Dive articles on various cybersecurity topics.
. . .
Oh, and if you want even more content and updates, hop over to Ryan G. Cox on Twitter/X or my Website. Can't wait to keep sharing and learning together!