
Detections as Code in DataDog (Pt. 2): How I Test Detections
Cybersec Café #90 - 11/04/25

A couple months back, I shared how I built a Detections-as-Code MVP implementation for my small security team using the DataDog SIEM - walking through the design decisions that let me ship an early version fast and start reaping the benefits of an “as-code” workflow within just a couple of weeks.
If you haven’t read that one yet, I’d recommend jumping back there first so this part makes more sense: https://www.cyberseccafe.com/p/detections-as-code-in-datadog-how
One of the key benefits I mentioned briefly was automated testing through the CI/CD workflow, and that’s exactly what we’re diving into today.
I’ll break down how I test detections end-to-end, how this fits into the automation pipeline, and how you can replicate it in your own environment.
And for subscribers, I’ve set up a demo repository that shows the entire implementation in action, Pt1 and Pt2 - available now inside Cybersec OS.
Let’s get into it.

The Methodology
Part of my solution is the methodology I use to ensure that a detection is truly ready to be pushed into production.
At its core, this approach serves as quality control, preventing broken or overly broad detections from slipping through and causing noise or missed alerts.
Now, there are certainly more advanced ways to test detections. In large-scale environments where cost and scale are critical, you could build out a full staging environment and validate detections there first.
But my goal here is speed and effectiveness. I wanted an MVP that serves as a practical, lightweight testing framework that adds confidence without slowing deployment down.
Requirements
Every detection must meet the following criteria before being merged:
True Case (Mandatory) - Ensures the detection actually fires as intended. Each test must include at least one log containing all the necessary fields for the rule to trigger successfully.
False Case (Mandatory) - Validates that the detection doesn’t fire when it shouldn’t. This prevents overly broad logic and reduces false positives in production.
Edge Case (Optional) - An edge case should nearly match the detection logic but miss one key condition. This adds confidence that detections only fire under precise circumstances.
Example: if a rule is meant to trigger on specific actions except when performed by a known service account, the edge case would simulate the action from that service account, ensuring it correctly returns false.
Additional Cases (Optional) - In Datadog, detections often consist of multiple queries. During peer review, I recommend enforcing at least one true case per query. This keeps quality consistent across the entire detection, not just the main condition.
The Script
After a bit of digging through the docs, I was able to find an API endpoint from DataDog that lets me test detection logic directly against sample logs - perfect for validating our test cases automatically.
The idea was simple: build a script that takes a detection’s YAML file, formats it into the JSON parameters the API expects, sends it to the endpoint, and outputs the results.
This is also where we enforce our testing requirements.
A detection “passes” only if it includes at least one True and one False test case, both behaving exactly as expected. If any single test case fails, that detection fails. And if one detection fails, the entire log source folder fails.
It’s surprisingly straightforward once you break it down. As long as we avoid overengineering early on, we can reach a functional, automated system much faster.
You can find the full code snippet at the bottom of this post or in the demo repository.
- Today’s Sponsor -
IRHQ is a modern suite of tools designed to help security teams respond faster, reduce risk, and stay audit-ready. It’s the first platform to combine:
Incident Management - track and resolve incidents efficiently
Built-in Post Mortem Frameworks - turn every incident into actionable and trackable action items
Advanced Analytics - measure performance, spot trends, and improve security posture
Compliance Reporting - simplify audits and show evidence of strong controls
Take control of your IR operations and make IRHQ your go-to Incident Response Headquarters.
Phase I: CI/CD Automation
The first phase of my testing approach was, without question, the most critical.
It was logical that the CI/CD pipeline responsible for deploying detections should also handle their automated testing.
The first version of this workflow ran tests on every commit, with an option to manually trigger tests for specific detection folders when needed. And this entire pre-PR workflow had to pass before a Peer Review could even begin - meaning at least 1 folder must pass.
Why? Because no new detections should make it into production without passing the pipeline first.
Once tests passed, the Peer Review phase kicked in. Reviewers verified that the correct folders were tested, and authors were expected to attach a link to their passing test results in the pull request comments.
From there, reviewers confirmed that all mandatory test cases (one True and one False) were present, and encouraged authors to include the optional Edge and Additional cases for extra assurance.
Finally, once approved, the pipeline enforced that all log source subfolders in the detections directory had to pass testing. If even one unrelated detection to the Pull Request failed, no new deployments could proceed.
This is to strictly enforce that only functional detections can make it into our production environment.
This setup gave my team a solid foundation for our Detections-as-Code workflow, but it also surfaced a few pain points that would shape our next phase.
Phase II: Local Testing
As I started building my first batch of custom detections and porting over the out-of-the-box ones from DataDog into code, I began noticing clear friction in my testing workflow.
Every time I wanted to verify a small change, I had to commit the code, wait for the CI/CD job to spin up, let it run through Terraform checks, and finally manually trigger the test folder.
In total, a single test cycle could take 3-5 minutes just to confirm if a detection worked correctly. With the amount we’re expecting to utilize this workflow in the future, the time cost becomes painful fast.
So I asked myself: I already have the testing infrastructure… what if I could know my code was correct before even committing it?
Enter the Python script.
I built it by repurposing the same logic from my CI/CD testing script and made it callable directly from the command line. This let me instantly test a single detection or an entire folder - no waiting, no pipeline delay.
The benefits were immediate: iteration became faster, wait times disappeared, and merge requests were cleaner since I no longer needed to squash a pile of micro-commits.
Best of all, it’s low-maintenance and consistent. By using the same core testing logic both locally and in CI/CD, I’ve kept testing predictable across environments - while moving a lot faster.

The Cybersec Café Discord is officially live! Join a growing community of cybersecurity professionals who are serious about leveling up. Connect, collaborate, and grow your skills with others on the same journey. From live events to real-world security discussions — this is where the next generation of defenders connects. Join for free below.
Moving Forward…
While I have an MVP in front of me, it’s far from perfect.
For starters, my current implementation supports manually running specific folders. I made that choice intentionally because I felt it would give detection engineers flexibility to test only the detections they were actively working on, without waiting for the entire project to pass.
However, this has its drawbacks, because when developing detections, it means I have to manually kick off portions of the job each time. A better long-term approach would be for the pipeline to automatically detect which folders changed and dynamically run tests against only those. That’ll be my next quick win.
Another improvement on my roadmap is to dynamically set test case requirements based on each detection’s complexity. Instead of always requiring one true case, I could scale requirements based on the number of queries - ensuring every query has a mapped test case. This would tighten quality and scale much better over time.
Lastly, I plan to add support for additional detection types. While I’ve covered the most common ones, DataDog’s Terraform modules include quite a few variations. My YAML-based approach simplifies things, but it also adds complexity - requiring dynamic Terraform blocks rather than simple copy-paste patterns for new types.
That said, the turnaround from no detections-as-code to a fully automated CI/CD pipeline, complete with tests and our most popular detections migrated, was at just about one month.
The lesson? MVP > Perfection.
Ship fast, learn, and continuously evolve.
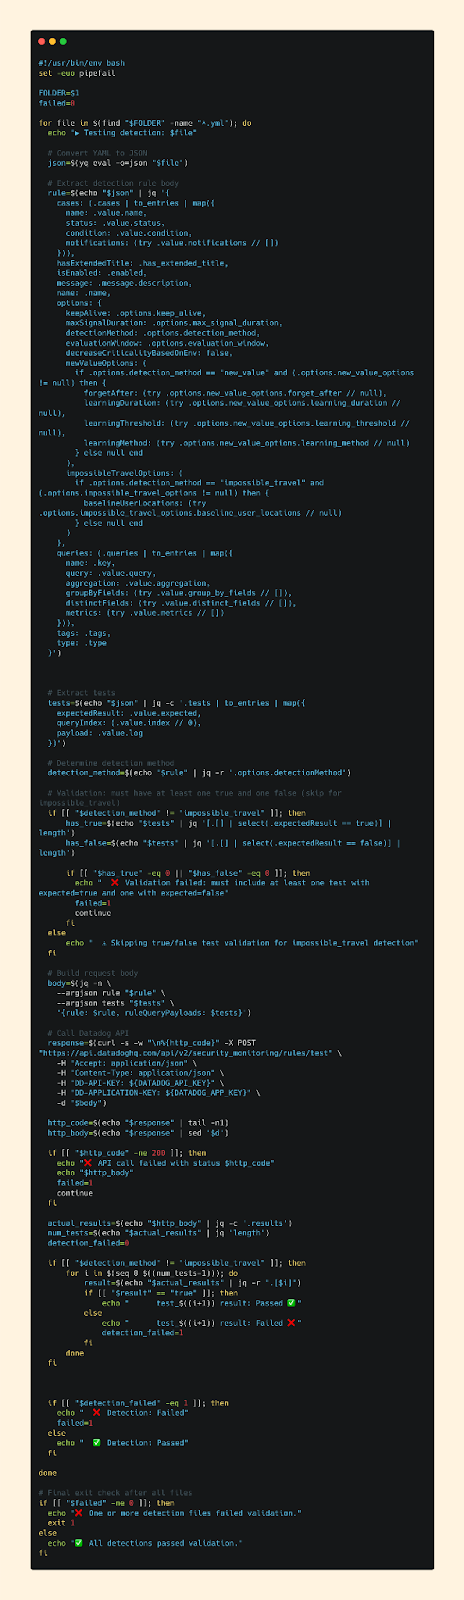
Bash Script
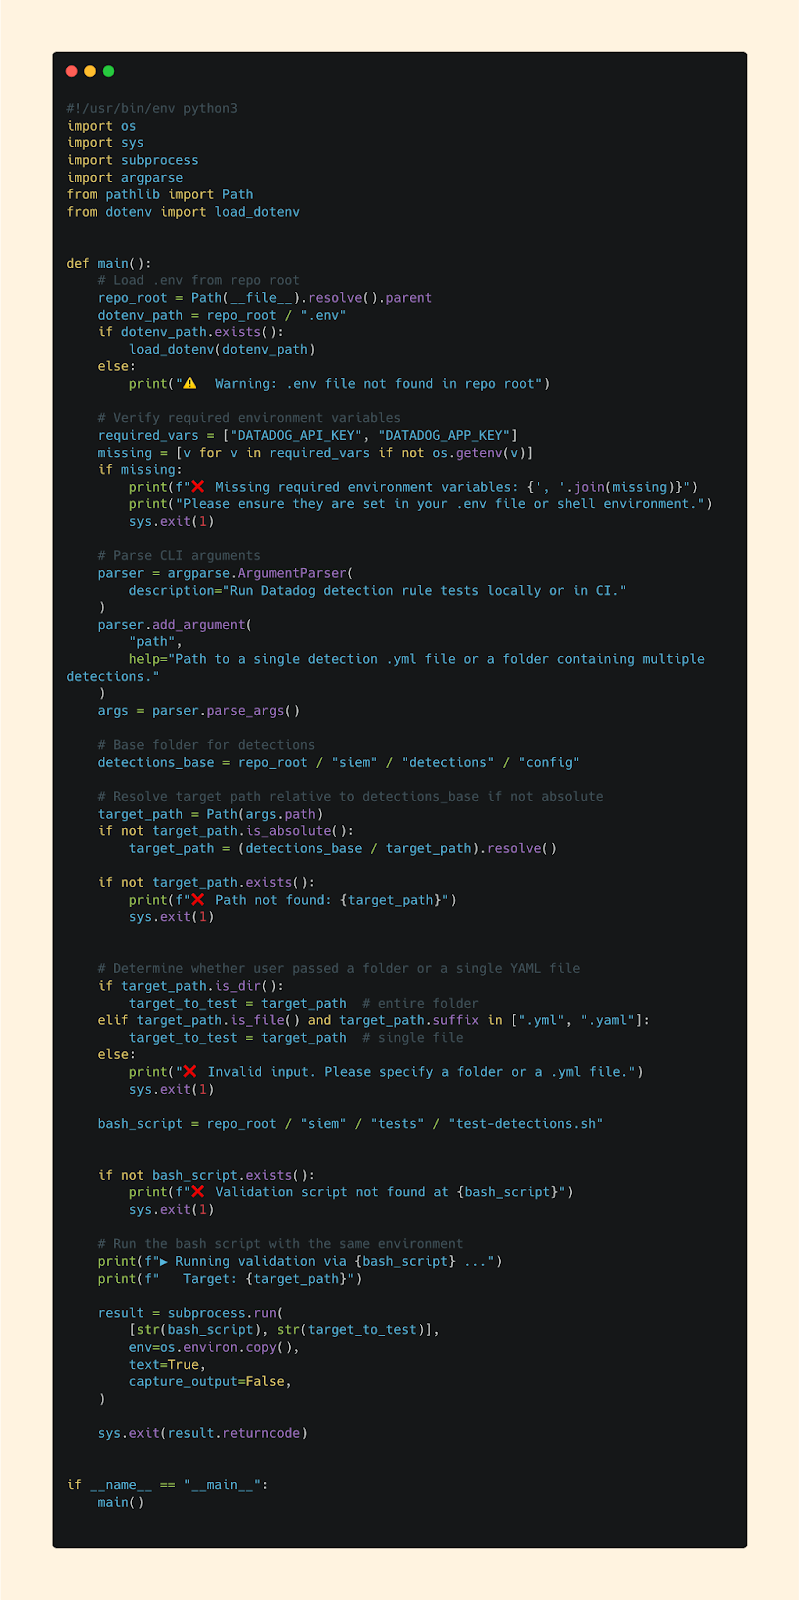
Python Script
Securely Yours,
Ryan G. Cox
P.S. The Cybersec Cafe follows a weekly cadence.
Each week, I deliver a Deep Dive on a cybersecurity topic designed to sharpen your perspective, strengthen your technical edge, and support your growth as a professional - straight to your inbox.
. . .
For more insights and updates between issues, you can always find me on Twitter/X or my Website. Let’s keep learning, sharing, and leveling up together.